Statistics Question
I took a statistics class in college, but I didn't pay much attention due to never seeing a need for the knowledge. Much of my education is like this: "Why the hell would I ever need this", only to find out years later that I desperately needed it (yeah, I'm talking to you, high school algebra).
Thimbleweed Park is out on seven different digital stores and each of them has a completely different way of reporting sales. It's time-consuming and frustrating to download each sales report once a month and hand massage the data into a useable format.
I spent the last few days writing a python script to take all the data and move it into a single SQL database so I could quickly query tons of useful information.
@@pre@@ SELECT countries.country, SUM(sales.units_sold) AS units_sold FROM sales JOIN countries ON sales.country_code = countries.country_code WHERE units_sold > 0 GROUP BY sales.country_code ORDER BY units_sold DESC @@pre@@
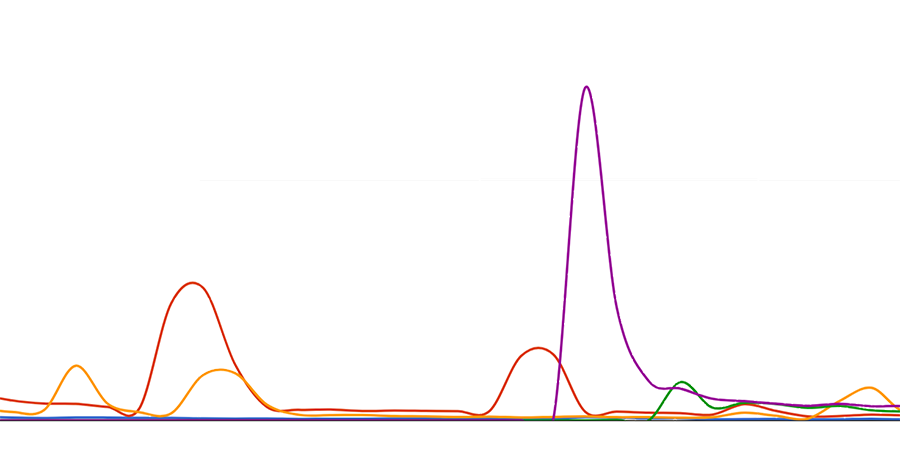
One thing I want to know is an "average" units/day for each store, so I can keep an eye on long-term trends. Sounds easy, except for sales and promotions happening all-to-often, and they produce huge spikes in the data that I don't care about. I just want to see an average for average non-sale days and I don't want to go in and remove the sale ranges as sometimes they happen without my knowledge.
I'm looking for a way to take an average that removes spikes that are well above the average. This doesn't have to be in SQL, that computation will most likely happen in a spreadsheet, or could happen in the report generation if it's too complex.
Maybe this isn't possible, but I figured I'd ask.
https://support.office.com/en-us/article/TRIMMEAN-function-d90c9878-a119-4746-88fa-63d988f511d3
It might require some tweaking, depending on how many outliers exist in the data sample, which in turn depends on how common the sales/promotions are and how long is the period of time that you are analyzing.
This consultancy is not free. Please send Thimbleweed Park merchandise.
Histograms are handy for this in general since if you build one appropriately, you can use it to estimate pretty much any percentile (say 5%, 10%) in your whole dataset.
You could eliminate data that is higher frequency than, say, 5 days, leaving you with data that trends for at least a week of sales. That would also mean eliminating the indirect effects of the sale, assuming that there are still some sales happening after the sale, but still indirectly because of it due to word of mouth or what have you. Basically, any short term trends
Then convert it back from the frequency domain to the time domain and you'll be left with just a nice trendline, without spikes, and can go from there for averages. Some tweaking for exactly what data to cut off would need to be done to tune it just how you want it

Alternatively calculate a running winzorised mean. https://en.wikipedia.org/wiki/Winsorizing
https://en.wikipedia.org/wiki/Multimodal_distribution
For each store, you can think of non-sale days and sale days as a distribution around a mean with deviation associated. Draw a histogram, fit the two curves, and remove the upper one to get stats about the lower one.
It might not work so well though because they're more decay functions than normal distributions, so the better version might be to fit a bimodal log-normal curve:
https://en.wikipedia.org/wiki/Log-normal_distribution
But that might be overkill..
declare @filter decimal(5,2)
set @filter = 1.5
SELECT c.country, SUM(s.units_sold) AS units_sold
FROM sales s JOIN countries c
ON s.country_code = c.country_code
WHERE units_sold > 0
GROUP BY sales.country_code
HAVING SUM(sales.units_sold) < @filter * (
SELECT AVG(unitsperday) from
(SELECT SUM(sales.units_sold) AS unitsperday
FROM sales
WHERE units_sold > 0 and sales.country_code = s.country_code) as average)
ORDER BY units_sold DESC
FROM sales
WHERE units_sold > 0 and sales.country_code = s.country_code) as average)
ORDER BY units_sold DESC
If im not mistaken, that query would remove every day that's higher than 1,5 * day average for that country.
Hope this helps.
declare @filter decimal(5,2)
set @filter = 1.5
SELECT c.country, SUM(s.units_sold) AS units_sold
FROM sales s JOIN countries c
ON s.country_code = c.country_code
WHERE units_sold > 0
GROUP BY sales.country_code
HAVING SUM(sales.units_sold) < @filter * (
SELECT AVG(unitsperday) from
(SELECT SUM(sales.units_sold) AS unitsperday
FROM sales
WHERE units_sold > 0 and sales.country_code = s.country_code) as average)
ORDER BY units_sold DESC
In a spread sheet, there should already be a median function implemented. In SQL maybe there is also already a median funciton, if not it should be easy to implement.
Basically, for each series:
AVERAGE + (DEVIATION STANDARD)*K
(K = your amount of deviation from the average). That amount is called "average square deviation".
The Excel formula would be, for instance:
=AVERAGE(A1:A1138) + ( STDEV(A1:A1138) *5 )
assuming your range is from A1 to A1138, and your arbitrary parameter that deviates from the average is 5.
=HARMEAN(range)
It returns the HARMONIC MEAN.
I have tested it on an excel spreadsheet, comparing the =AVERAGE function in a range of datas without peaks, and the =HARMEAN on the same range of datas with peaks, and the results are very close.
Other option, as already mentioned is to exclude outliers from your sales distribution. In Excel you can use TRIMMEAN, but that will remove also the lowest entries in your distribution. You probably want to exclude only highest peaks, and I think an easy way to accomplish that is using the average and standard deviation.
So, assuming your sales data is in the A column, you calculate the average of all values:
Make the cell B1 be
=AVERAGE(A1:An)
And cell C1 be:
=STDEV(A1:An)
Cell D1 will be:
=IF(A1-B1>C1*deviationFactor,"",A1)
Being the deviationFactor a number that controls how high the peaks have to be to be removed.
Copy this formula to cells D2:Dn, taking care only the index in A is changed (average is always in B1 and standard deviation in C1, but original data is in A1:An).
You will have the data without the peaks in the D column. So you just need to get the Average of that column.
-Grab the middle of your list as median or and average of the middle values
-You got your average sales value without peaks...
(In my case is running on an micro for filtering sensor inputs, so, pretty efficient approach if the sort is fast)
https://www.periscopedata.com/blog/outlier-detection-in-sql